- Aquaculture farming has expanded from coastal areas to near-coastal brackish-water and inland freshwater areas, and they widely adopts intensive farming technologies for higher yield.
- These cause issues such as increased soil salinization, water consumption and methane emission.
- Satellite remote sensing can provide unique and comprehensive mapping of aquaculture, including aquaculture-related landcover/use changes and aquaculture farming activities.
- Combined with technical and social surveys, the patterns of aquaculture changes can be revealed.
- Stronger actions at the national, regional, and farm levels are needed to regulate aquaculture intensification and expansion to meet the sustainable development goals (SDGs) and adapt to climate changes.
How is land cover/use classified?
Aquaculture was traditionally undertaken in coastal areas, many of which was converted from mangrove ecosystems. In recent years, coastal aquaculture areas contracted due to a variety of factors such as persistent disease outbreaks and sea level increase. Meanwhile, staring in 1980s, aquaculture began to expand into near-coastal brackish-water areas and inland freshwater areas, whereby wetland and rice paddies were converted into aquaculture ponds. These new aquaculture areas widely adopt new intensive-farming technologies, with frequent feed and water exchange, closed-water systems, and small-sized ponds (Fig. 1), that allow for high fish/shrimp stocking densities and produce high yield [1].
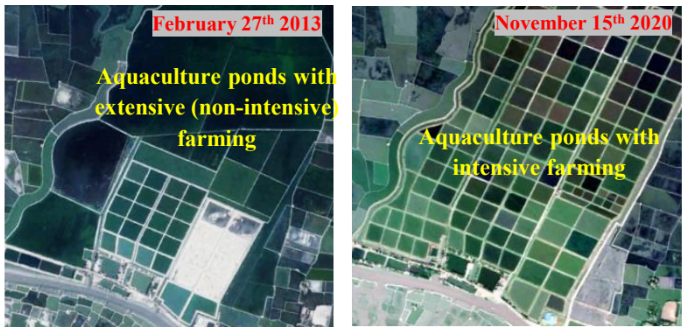
Fig. 1: 2013 and 2020 Maxar WorldView-3 high-resolution images showing aquacultural intensification (from large ponds to small ponds) for a 1.2 km × 1.2 km area in Jamalnagar, Satkhira, Bangladesh. Images are provided by NASA CSDA Program.
Why is this Important?
Globally, aquaculture has expanded faster than any other major food production systems, and has increased by 700% since 1990 to 64 million metric tons with a market value of $138 billion in 2020 [2][3]. Also notably, aquaculture has the highest methane emissions per area among freshwater systems, especially from small-sized shallow ponds with intensive farming [4][5]. However, there are no comprehensive maps to monitor aquaculture-related land cover/use changes and aquaculture farming activities.
How satellite data are being used to inform decision making and Earth Action?
Satellite data are used to map expansion, contraction, intensification (large ponds to small ponds), and annual farming cycles in S.E Asia. Combined with surveys, this provides essential measurements to support national- and regional-scale decision making and farm-scale management to make aquaculture meet the sustainable development goals and adapt to climate changes.

[1] Chamberlain 2010. History of shrimp farming. [2] FAO 2018. https://www.fao.org/3/i9540en/I9540EN.pdf. [3] FAO (2020). Fishstat J. [4] Malerba et al. 2022. Commu. Earth & Envir., 3(1), 306. [5]. Zhang et al. 2022. Agri. Ecosys. & Envir., 338, 108110.
Project Investigator: Lin Yan, Michigan State University, MI, USA; Email: yanlin@edu.edu
The opinions expressed are solely the PI's and do not reflect NASA's or the US Government's views.