- We created methods and free software to analyze time series maps of land classes.
- Our methods quantify alternation, where a land class gains then loses at the same location.
- Transition from Savannah to Temporary Crops to Soybean is a typical sequence.
- The Total Operating Characteristic shows that Soybean gains closer to larger patches.
- Future scenarios outline a range of options for land policy and irrigation decisions.
How is land use/cover being changed?
We created methods and free software to reveal land change patterns that previous methods overlook in a time series of maps. Alternation is a pattern where a land class gains then subsequently losses at a location. Our novel method of Trajectory Analysis applied to our Brazilian site reveals that alternation accounts for most of the change in soybean agriculture [1]. Our novel method of Change Components Analysis shows that transitions from Savanna to Temporary Crops to Soybean is the typical sequence through which Soybean gains [2]. Figure 1 shows the results where bars that extend above the horizontal axis are gains while bars that drop below the axis are losses. Our method of the Total Operating Characteristic measures the predictive power of land change models in ways that other validation methods miss [3].
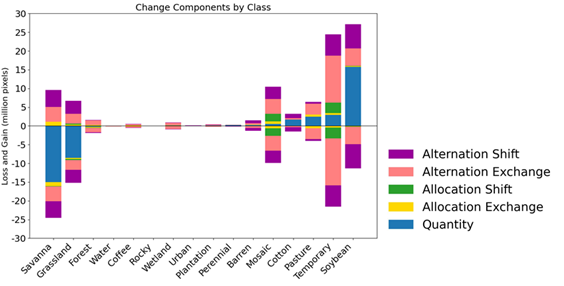
Figure 1: Change Components Analysis reveals that most change is alternation while Savanna loses most and Soybean gains most in western Bahia, Brazil [2].
Why is this Important?
Our profession’s ability to create time series of land cover map has outstripped our ability to analyze the time series efficiently. Therefore, we created new methods to reveal the patterns that scientists should prioritize for analysis. Trajectory Analysis reveals the dynamics of one class. Change Components Analysis reveals the dynamics of multiple classes. The Total Operating Characteristic quantifies the predictive power of models. All three methods are helpful to link patterns to processes and to identify suspicious data that might derive from classification errors.
How are satellite data being used to inform decision making and Earth Action?
We are combining satellite data with qualitative political ecology analysis to develop scenarios of future land change and irrigation. Satellite data provides the empirical backbone of the scenario modelling that will inform policy decisions concerning environmental conservation and water use.

[1] Bilintoh et al., 2025. Transactions in GIS, 29(8).
[2] Pontius and Fonseca, 2025. Transactions in GIS, 29(7).
[3] Honnef and Pontius, 2025. ISPRS International Journal of Geo-Information, 14(4).
Project Investigator: Robert Pontius, Clark University, MA, USA; Email: rpontius@clarku.edu
The opinions expressed are solely the PI's and do not reflect NASA's or the US Government's views.