- Irrigation associated water fluxes locally improve soil moisture and humidify the atmosphere, buffering the feedback mechanism of flash droughts
- Latent heat can be expected to increase by 50% from heavily irrigated areas. (Huber et al, 2018)
- The study domain has ~34.4% of grid cells have at least some irrigated area. Heavily irrigated areas like eastern Nebraska may alter dynamics downstream.
Vegetation Feedbacks & Flash Drought Intensification
Flash droughts are characterized by their rapid onset and intensification, driven by a swift decline in root zone soil moisture. Vegetation actively participates in the land-atmosphere feedback loops that govern the evolution of these events. When environmental stress reduces vegetation greenness, transpiration is curtailed, which lowers latent heat fluxes and shifts surface energy partitioning toward sensible heat.
This shift subsequently warms and deepens the planetary boundary layer, substantially increasing the vapor pressure deficit and overall atmospheric evaporative demand.
Ultimately, this creates a positive feedback loop that further stresses the remaining vegetation and amplifies the meteorological drought conditions.
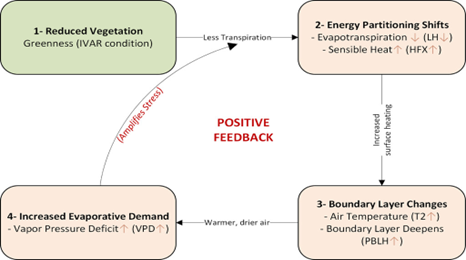
Figure 1: Figure 1: Illustration of the land-atmosphere positive feedback mechanism amplifying flash drought severity in WRF simulations. The sequence initiates with (1) diminished vegetation greenness, causing (2) a reallocation of surface energy partitioning that favors sensible heat (HFX) over latent heat (LH). This thermal shift (3) expands and warms the planetary boundary layer (PBL), directly causing (4) an elevated vapor pressure deficit (VPD). The resulting spike in evaporative demand amplifies vegetation stress, continuously reinforcing the drought loop (Osman et al., 2026).
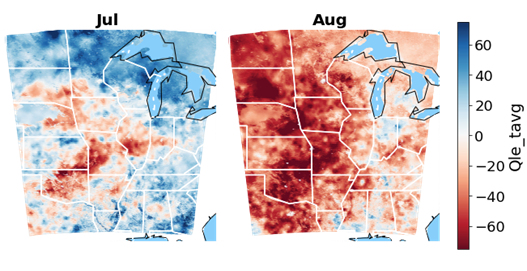
Figure 2: Spatial distribution of latent heat fluxes (Qle_tavg) across the US Great Plains during the July and August peak of the 2012 flash drought.
Irrigation as a Drought Mitigation Factor
Anthropogenic land-use changes, specifically the application of irrigation, can buffer the severe feedback mechanisms associated with flash droughts. Irrigation-associated water fluxes locally improve soil moisture and humidify the atmosphere, which might even influence precipitation downstream.
By simulating irrigation using the NU-WRF modeling framework, experiments demonstrate an alteration in surface energy partitioning where latent heat fluxes increase and sensible heat fluxes are reduced. In heavily irrigated areas—such as eastern Nebraska during the 2012 US Great Plains flash drought—latent heat can be expected to increase by up to 50%, effectively slowing down the rapid intensification and land-surface drying typical of these extreme events.
These shifts in energy partitioning, along with changes in net radiation and surface albedo, alter the overall structure of the planetary boundary layer. Understanding these complex dynamics is crucial for developing effective drought mitigation strategies and improving regional resilience against future climate extremes.
Experiments Setup
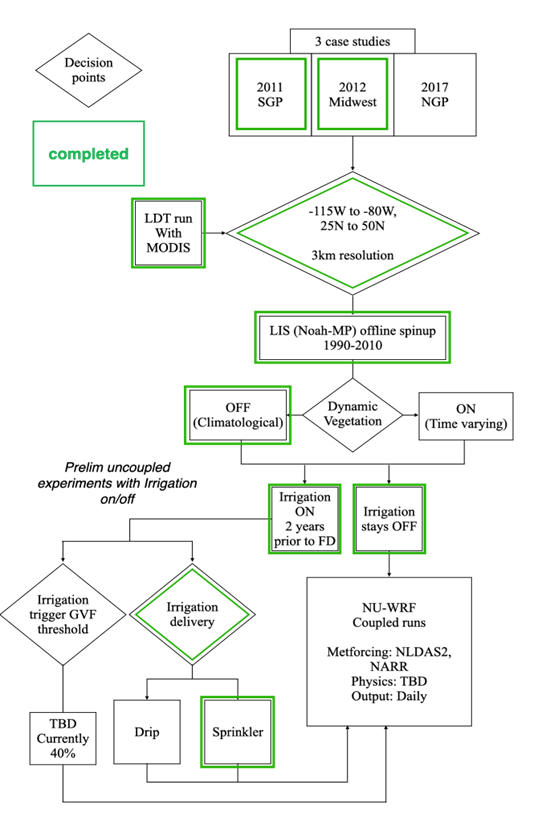
Figure 3: Flowchart detailing the modeling framework designed to test the sensitivity of land-atmosphere interactions to varying irrigation and vegetation parameters.
Sensitivity experiments
We employ Noah-MP coupled with WRF on the NU-WRF framework, using meteorological forcing from NLDAS-2 to simulate the largest flash drought in recent memory: the US Great Plains flash drought of 2012. 20-year offline spin-up provides initialization to two test cases: irrigated and control simulations for 2 years prior to the flash drought.
These initializations are used as input to a 6-month run in NU-WRF and assessed on the sensitivity of energy partitioning and boundary layer dynamics to the applied irrigation.
In addition to the irrigation sensitivity experiments, we also designed a separate experiment to assess the effects of prescribing time-varying greenness vegetation fraction (GVF) versus climatological GVF.
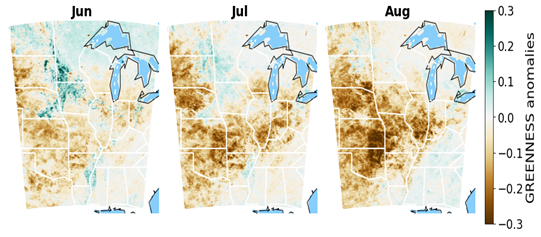
Figure 4: Green vegetation fraction anomalies (2012 vs. climatology), illustrating the intensifying drought stress across the US Great Plains from June to August.
Applied irrigation maps
Irrigation maps are derived from MODIS data used in combination with 175 crop classifications (Monfreda et al., 2008). The maps are applied to the LIS sprinkler routine described by Ozdogan et al., 2010. The irrigation routine is governed by the following parameters:
Where to irrigate: IRRIGFRAC maps define irrigated area within each grid cell
When to irrigate: Greenness (GVF) threshold combined with soil moisture deficit trigger water application at 6am
How much to irrigate: Determined by delivery method (sprinkler) and land parameters (root-zone depth for classified crops and the field capacity).
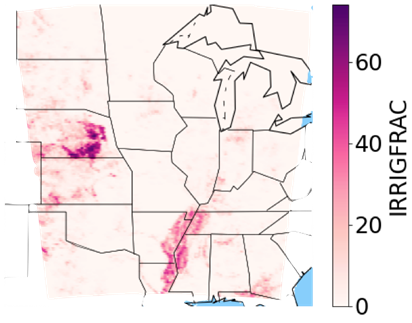
Figure 5: Fraction of irrigated area per grid cell in the US Great Plains. The map highlights heavily irrigated agricultural zones, such as eastern Nebraska, which can alter downstream drought dynamics.
Guiding mechanisms for investigation
There are three main mechanisms in which an additional water fluxes might influence the local and regional energy and water balance. The first is improving bulk humidity, which leads to precipitation downstream. Second, the changes in net radiation that we might expect altered albedo and the total radiation retained within the boundary layer. Finally, the third, which pertains to the changes in energy partitioning, explained by the feedback loop in Fig 6. This changes the structure of the boundary layer and thus the general state of the system.
Explaining Feature Relationships
Shapley Additive Explanations (SHAP) provide a powerful analytical method to quantify the specific relationships between surface and atmospheric variables and a target quantity, such as soil moisture. Prior work has utilized random forest modeling alongside SHAP values to explain how key climate index, surface, and atmospheric variables contribute to soil moisture predictions using MERRA-2 reanalysis data. This approach clearly illustrates which variables have the strongest relationship with the soil moisture prediction target and reveals how these complex land-atmosphere dynamics vary spatially across different regions.
This same analysis will be applied to the modeling approaches used in this work.
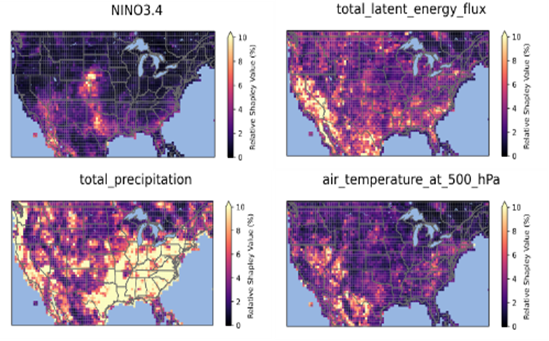
Figure 7: Shapley Additive Explanations for how surface, atmospheric, and climate index variables contribute to predictions of surface soil moisture with a 1-month lag.
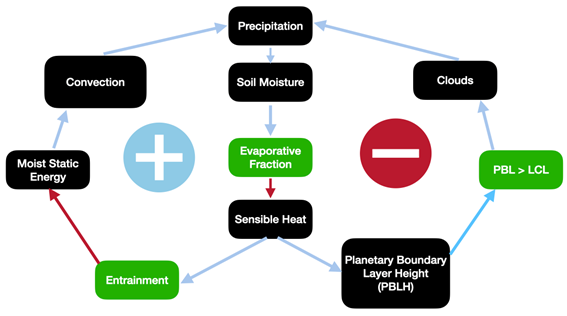
Figure 6: Altered soil moisture is expected to have a feedback mechanism by which we may expect local and downstream influence (Zaitchik et al., 2013).

Huber, D., Mechem, D., & Brunsell, N. (2014). The Effects of Great Plains Irrigation on the Surface Energy Balance, Regional Circulation, and Precipitation. Climate, 2(2), 103–128. https://doi.org/10.3390/cli2020103
Monfreda, C., Ramankutty, N., & Foley, J. A. (2008). Farming the planet: 2. Geographic distribution of crop areas, yields, physiological types, and net primary production in the year 2000. Global Biogeochemical Cycles, 22(1), 2007GB002947. https://doi.org/10.1029/2007GB002947
Osman, M., B. Zaitchik, P. Lawston-Parker, J. Santanello, and M. Anderson, 2026: The Interplay of Vegetation and Land–Atmosphere Feedbacks in Flash Drought Prediction. J. Hydrometeor., 27, 307–323, https://doi.org/10.1175/JHM-D-25-0074.1.
Ozdogan, M., and G. Gutman, 2008: A new methodology to map irrigated areas using multi-temporal MODIS and ancillary data: An application example in the continental US. Remote Sens. Environ., 112, 3520–3537, doi:10.1016/j.rse.2008.04.010.
Zaitchik, B. F., Santanello, J. A., Kumar, S. V., & Peters-Lidard, C. D. (2013). Representation of Soil Moisture Feedbacks during Drought in NASA Unified WRF (NU-WRF). J. Hydrometeor., 14(1), 360–367. https://doi.org/10.1175/JHM-D-12-069.1
Project Investigators: Nicholas Parazoo (PI), Jet Propulsion Laboratory; California Institute of Technology, Pasadena email: nicholas.c.parazoo@jpl.nasa.gov,
Mahmoud Osman (Co-I), NASA Goddard Space Flight Center; Greenbelt ESSIC; University of Maryland, College Park,
Benjamin F Zaitchik (Co-I), Department of Earth and Planetary Sciences, Johns Hopkins University, Baltimore, Gary Doran (Co-I), Jet Propulsion Laboratory, California Institute of Technology, Pasadena,
Sakshi Labhane, Department of Earth and Planetary Sciences, Johns Hopkins University, Baltimore
The opinions expressed are solely the PI's and do not reflect NASA's or the US Government's views.