Modeling of the Regional Carbon Cycle in Urban Environments: Patterns in US urban on-road Emission
The United States is home to 5% of the world’s population and 30% of the world’s automobiles, emitting 45% of global transportation CO2 emissions (DeCicco et al. 2006). In 2012, automobile emissions were 28% of total US fossil fuel CO2 emissions and accounted for almost half of the growth in total US emissions since 1990 (US EPA 2014). Despite being a substantial component of US emissions, on-road CO2 remains poorly quantified at sub-state and urban scales (Gately et al. 2013). As part of an interdisciplinary measuring and modeling effort to quantify urban-scale carbon flows, we have constructed a new 33-year,high-resolution inventory of annual on-road CO2 emissions for the United States. Results from this study (Gately et al., 2015) identifies large biases in regional estimates of CO2 from previous inventories that relied on population as a linear predictor of vehicle activity, and highlight the importance of cities as sources of CO2 and the need for improved fine-scale inventories for monitoring and reporting of emissions. Reducing uncertainty in on-road CO2 emissions at finer spatial scales is critical for constraining carbon budgets, and for supporting greenhouse gas emission monitoring and abatement verification, particularly at the scale of cities, which have emerged as hubs of climate change mitigation activity.

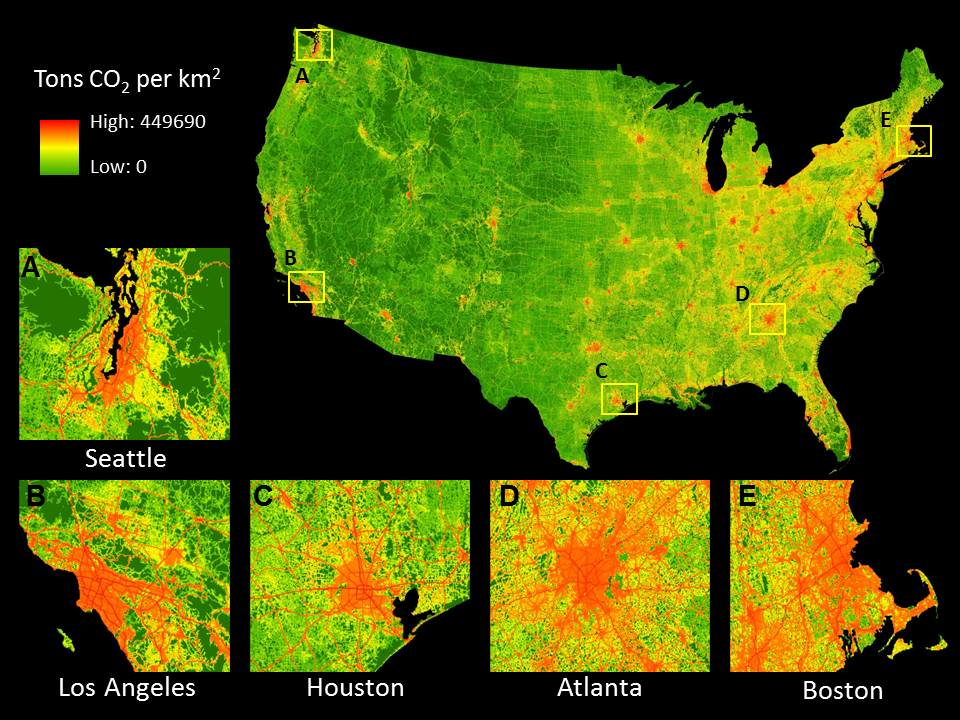
Figure 1. Map of 2012 on-road CO2 emissions for the coterminous United States and selected urban areas at a resolution of 1 km. (Insets) Maps show details of metro areas surrounding Seattle (A), Los Angeles (B), Houston (C), Atlanta (D), and Boston (E). Source: Gately et al. 2015.
Our new Database of Road Transportation Emissions (DARTE) shows large spatial variations in on-road CO2 emissions across the United States (Fig. 1).The 1-km spatial resolution rectifies sharp gradients in emissions around freeways and expressways, particularly in major urban areas. Total US on-road emissions increased by 50% from 1.04 Gt in 1980 to 1.55 Gt in 2012, with 80% of this increase occurring in urban areas.
We find large geographic differences in the density–emissions relationship suggesting that “smart growth” policies to increase urban residential densities will have significantly different effects on emissions depending on local conditions, and may be most effective at low densities.
A cross-sectional panel analysis of DARTE at the city-scale shows varying trends in the per capita emissions–density relationship for cities whose densities fall above and below 1,650 persons km-2 (Fig. 2).Cities such as Atlanta, Salt Lake City, and Phoenix experienced large increases in per capita emissions despite minimal changes in population density between 1990 and 2010, whereas San Francisco and Boston exhibited declining per capita emissions with rising density over the same time period (Fig. 2).These patterns reflect a combination of transit ridership/availability and patterns in suburban sprawl, with commuters driving into the city, but not residing in the urban center. Nationally, urban growth and residential densification should continue to reduce total on-road emissions, but in many of the fastest growing urban areas, total on-road emissions are likely to continue their steady increase.
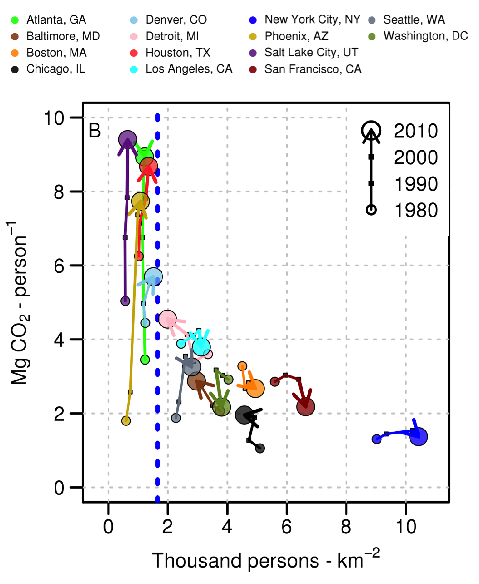
Figure 2. Trends in decadal per capita emissions vs. density for 14 US cities. Movement in time is denoted by point size and arrows. Source: Gately et al. 2015.
Urban areas are large, concentrated sources of carbon fluxes that are rapidly expanding around the globe.Urban areas currently comprise ~3% of global land area (Schneider et al. 2009), but their global urban extent is projected to double by 2050 (Seto et al. 2012). Improved quantification of urban-scale carbon flows will be critical for robust monitoring, reporting, and verification of greenhouse gas emissions. Read more about the project.