Revealing the Rhythms of the Vegetated City
Urban land covers alter the rhythms of regional climate on many time scales. Urban areas locally alter climate through changing the brightness and the dryness of urban surfaces, reducing wind speeds within cities, and increasing the concentration of air pollutants over cities. These changes interact to increase temperatures within and over cities relative to nearby rural areas in a phenomenon known as the urban heat island (UHI) effect. The intensity of the UHI effect is related to the spatial pattern of urban land covers, including the composition of and configuration of built-up areas with different uses (residential, industrial, commercial, tall buildings, transportation, recreation), the presence and proportion of open water and wetlands, and the amount and arrangement of vegetation (lawns, parks, woods, cemeteries, playing fields). Global urban areas cover a small fraction of total global land area, but their meteorological and ecological impacts extend far beyond nominal city boundaries. That urban vegetation strongly influences urban climate is widely acknowledged, but characterizing those influences in a consistent manner is challenging due to the fine-grained patchiness of vegetation in cities.
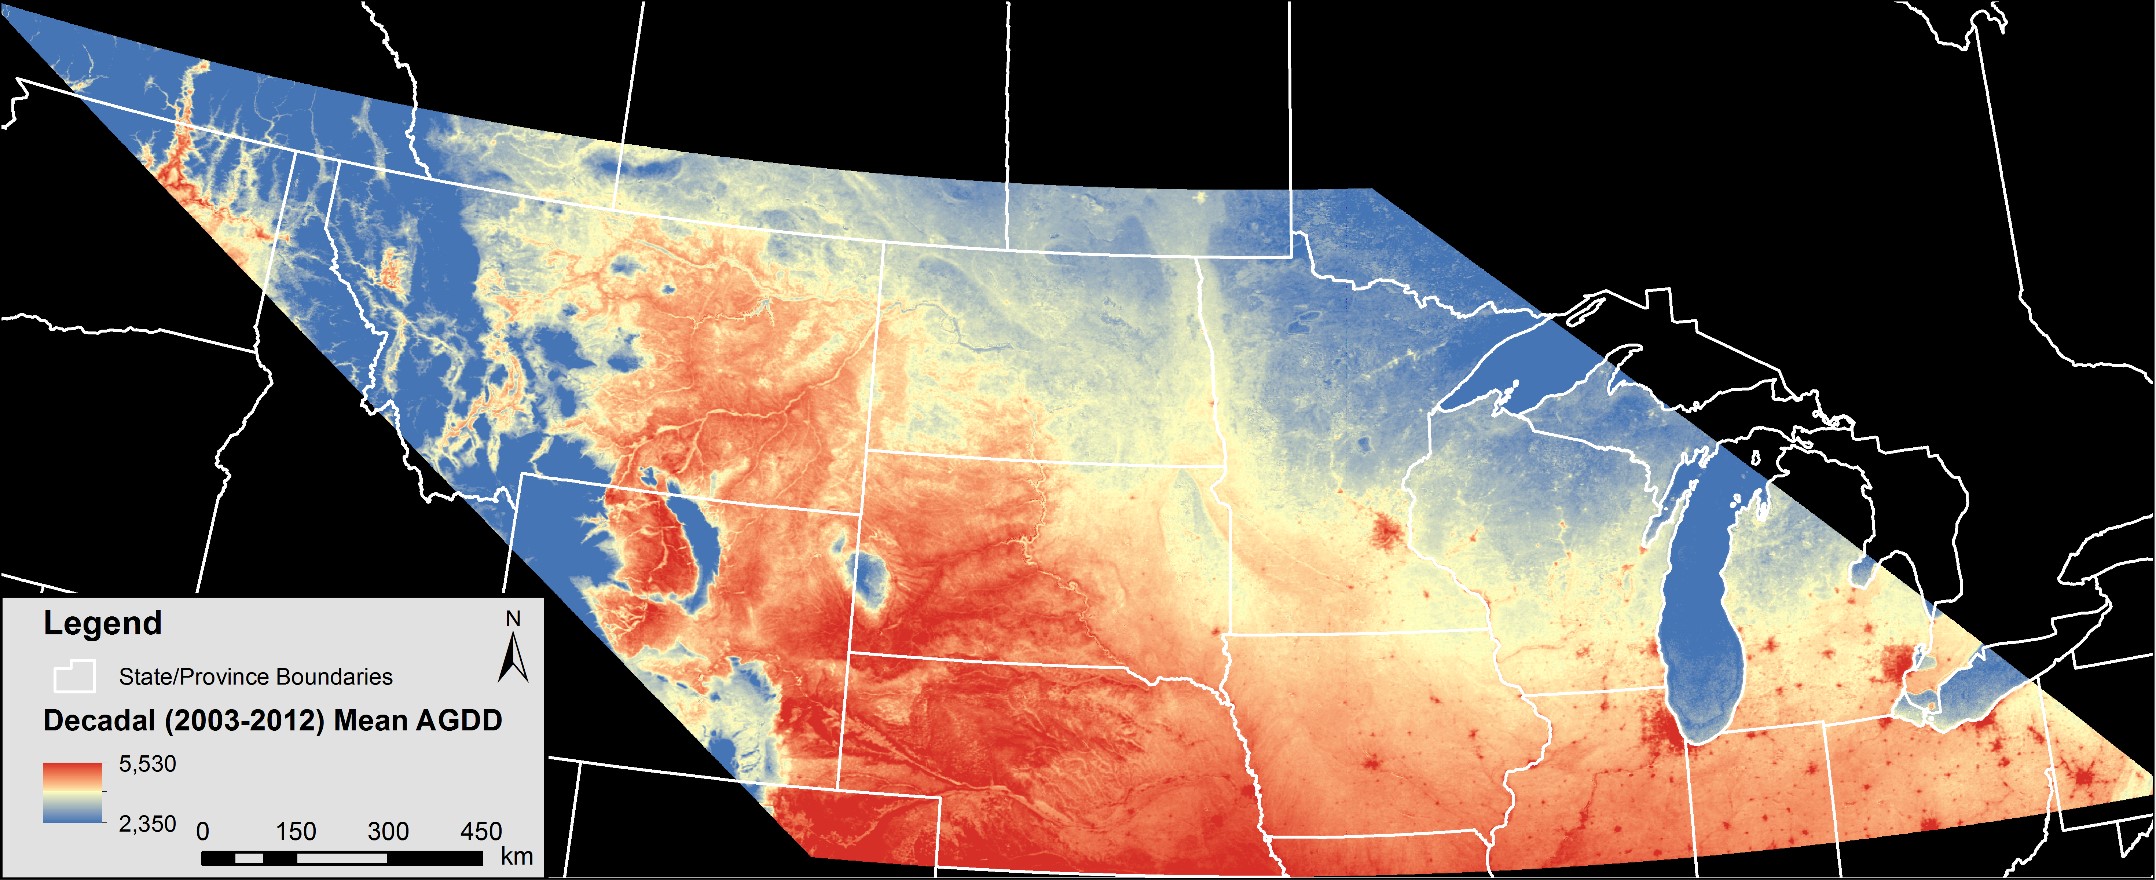
Figure 1: Decadal mean Accumulated Growing Degree-Days (AGDD) in MODIS tiles h10v04 and h11v04 generated from daytime and nighttime passes as 8-day composites at 1 kilometer resolution (MOD11A2 & MYD11A2). Data were filtered for snow cover using 8-day composites of maximum snow cover extent (MOD10A2 & MYD10A2). A total of 460 observations were used at each 1 km pixel (46 observations per year x 10 years) to calculate the decadal mean. The patches of dark red to the east are urban areas. The areas of blue are either open water or densely forested. Notice how apparent the cities are in the east when there are urban islands amidst croplands.
Within the frame of an interdisciplinary project investigating the impacts of urban areas on the behavior of severe summer storms in the US Great Plains, we are modeling the seasonality of urban vegetated surfaces by blending the time series of two remote sensing products with different spatial resolutions. A NASA MODIS product provides an 8-day composite of planetary “skin” temperature at 1000 meters. A NASA Landsat product provides the rolling composites of maximum surface “greenness” at 30 meters. Together these products can model the rhythm or phenology of the vegetated urban surfaces through a simple but robust functional relationship that uses Accumulated Growing Degree-Days (AGDD) to track the progress of vegetation development in response to recent weather rather than the day of year. This approach works especially well in regions where the interannual variation of growing season weather is high, such as in the Upper Midwest of the US (Figure 1). The transition of the rhythm of croplands to the rhythm of sparsely-treed new suburbs can be stark (Figure 2). These urban borderlands of suburban development constitute abrupt edges that storms encounter before reaching older, more built-up parts of the city.
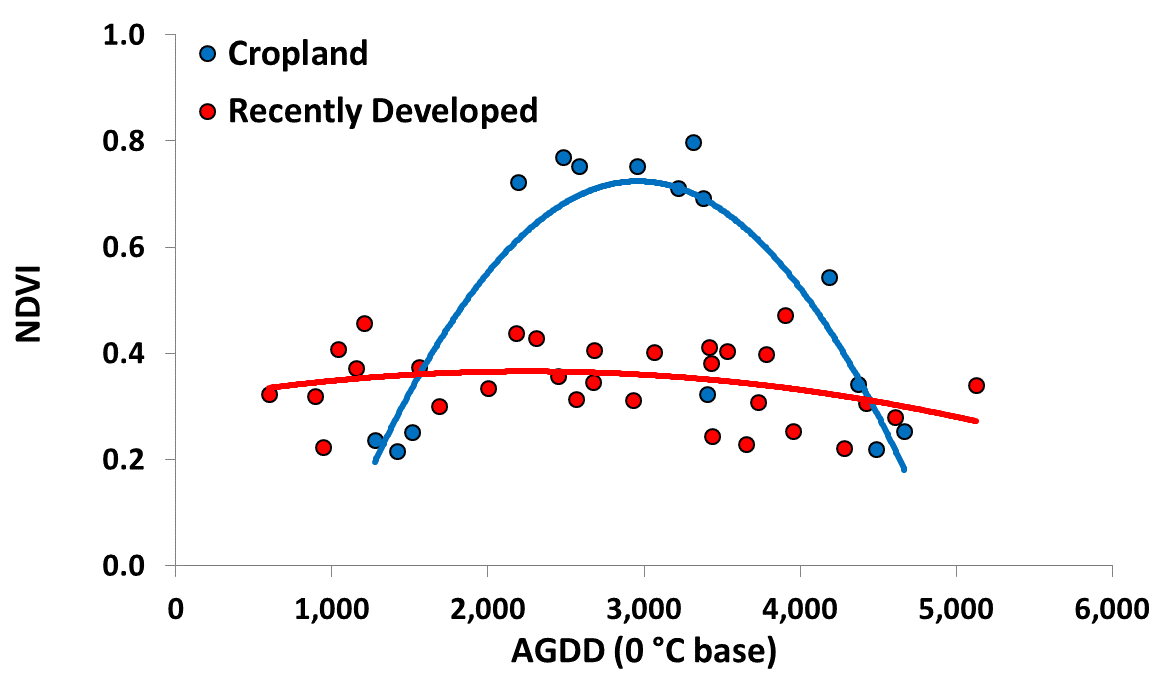
Figure 2: Change in land surface phenology arising from change in land use in a representative 30 m pixel on the edge of Omaha, Nebraska. Blue symbols indicate cropland observations between 2003 and 2005, and the blue line shows the convex quadratic model relating the Normalized Difference Vegetation Index (NDVI) to Accumulated Growing Degree-Days (AGDD). Red symbols indicate observations between 2006 and 2012, and the red line shows the fitted convex quadratic model to the data after the land use change to a residential development.
The webinar from November 2014 reviews the then-current results from multiple aspects of the project including computer simulations of a supercell thunderstorm interacting with different cityscapes, computer simulations of the influences of atmospheric chemistry within and outside of a urban plume on precipitation, analyses of weather radar time series over several large cities, geographic patterns of urban land surface phenology across the Great Plains, and an exploration into how to bring results from land change science to green infrastructure practitioners. Read more about the project
