Impact of Urbanization on the Continental US Surface Climate
US cities are home to more than 50% of the population and this is where climate change will be felt the most. Urban communities will be interested to know how cities interact with climate and the scientific community is interested to include the urban ecosystem functions in climate models. Scientists at NASA use data fusion from Landsat and MODIS to characterize US urbanization and model its impact on surface climate. For cities built within forests, daytime urban land surface temperature (LST) is found to be higher than that of vegetated lands. In Washington DC and Atlanta, daytime mean temperature differences between impervious and vegetated lands reach 3.3 and 2.0 °C, respectively, whereas for cities built in arid lands, such as Phoenix, urban areas are 2.2 °C cooler than surrounding shrubs. The study finds that the choice and amount of tree species in urban settings play a commanding role in modulating cities’ LST. At continental and monthly scales, impervious surfaces are 1.9 °C ± 0.6 °C warmer than surroundings during summer and expel 12% of incoming precipitation as surface runoff compared to 3.2% over vegetation. It also shows that the carbon lost to urbanization represents 1.8% of the continental total, a striking number considering urbanization occupies only 1.1% of the US land. With a small areal extent, urbanization has significant effects on surface energy, water and carbon budgets and reveals an uneven impact on surface climate that should inform upon policy options for improving urban growth including heat mitigation and carbon sequestration. Our results strongly support the concept that transpiration-driven cooling is a major factor modulating the SUHI, and that smaller cities, occupying about one third (35%) of their environment, may generate less heat. We find the ratio of surface runoff of each land cover class to incoming precipitation to be useful indicator for water discharge. We estimate the maximum carbon loss due to replacement of productive lands by ISs at 1.8% of the total uptake over the continental US as compared to 5.0% gain from agriculture. These carbon estimates are revealing of the significant impact of ISs on land productivity since agriculture represents 32.1% and the impervious area represents only 1.1% of the total continental US.
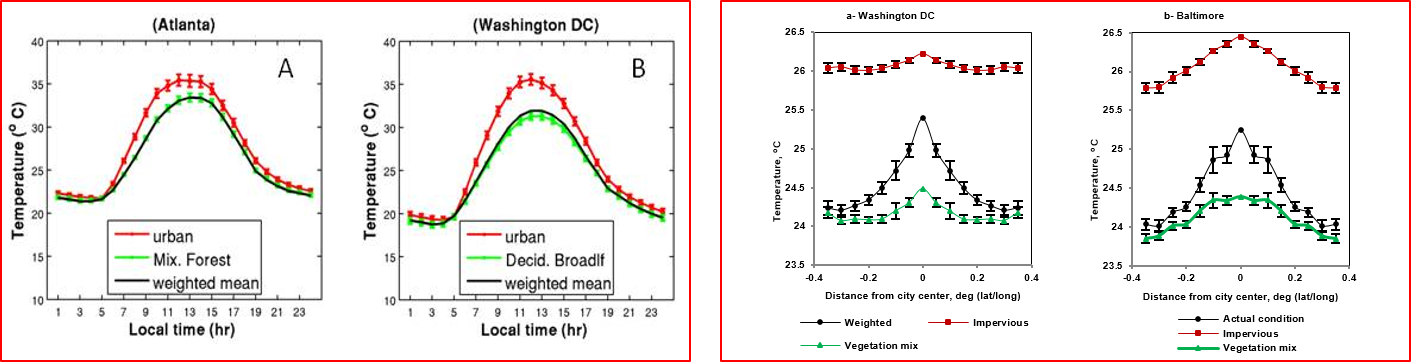
Figure 1. Left two figures show the June-July-August mean diurnal cycle of surface temperature for urban (red), dominant vegetation (green) and the weighted average for all land cover types (excluding urban) (black) for Atlanta (a) and Washington DC (b), These temperatures are simulated by the Simple Biosphere model (SiB2) forced by half hourly meteorological data at 5kmx5km obtained from the North American Land Data Assimilation System NLDAS-2, for the year 2001. The figures on the right show average surface temperature profile across the centers of Washington DC and Baltimore cities for summer (June-July-August). The “Impervious” scenario represents the surface temperature if the area was fully (100% ) impervious. The “Weighted” scenario represents the average surface temperature weighted by fractions of all existing LC classes including urban (Actual situation). The “Vegetation mix” temperature profile is obtained by replacing the impervious surface area with a mixture of all vegetation classes co-existing in the area and is a proxy for pre-urban “Pre-Urban”.
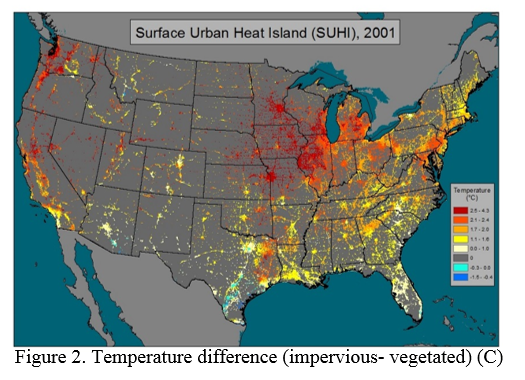
In most US cities, the material used in buildings and pavement construction absorbs more energy causing urban surfaces and the air immediately around them to warm faster than surrounding vegetated areas, creating an UHI. The SiB2 model reproduces distinct responses from different land cover (LC) elements forced by the same atmospheric variables, and captures the UHI with results in agreement with observations (Oke 1982, Imhoff et al 2010) and modeling studies (Shepherd 2006, Bounoua et al. 2009). Except for cities built in desert-like environments such as Phoenix AZ, where the model simulated an urban heat sink (UHS), for all cities built in vegetated lands, the modeled urban surface temperature is warmer than that of the surrounding vegetated land creating thus well-defined UHIs (Fig.2).
At the continental and monthly scales, spatially averaged over all pixels having more than 1% IS, we find urban lands warmer than their surroundings by 1.9 °C ± 0.6 °C during summer and 1.5 °C ± 0.4 °C during winter. These results are in agreement with satellite estimated global average summer and winter UHI of 2.6 and 1.4 °C, respectively (Zhang et al 2010).
This suggests that with increases in worldwide temperatures associated with global warming, cities may experience higher temperatures sooner than expected and the global average 2 °C upper limit endorsed by the United Nations Framework Convention on Climate Change may need to be revised for cities, which will host about 50% of the total population by 2050 (UNFPA 2007). Furthermore, our results indicate that the SUHI is quasi-insensitive to ISA fraction smaller than 35% and increases linearly after that (figure 3) which suggests that small cities, occupying about one third (35%) of their environment, may generate less heat.
Unlike previous studies providing a static remote sensing analysis of the UHI effect over the Continental US; we use a fusion of Landsat and MODIS products within the SiB2 model to dynamically simulate the impact of urbanization, as a form of land use, on the surface energy, carbon and water cycles for the year 2001.

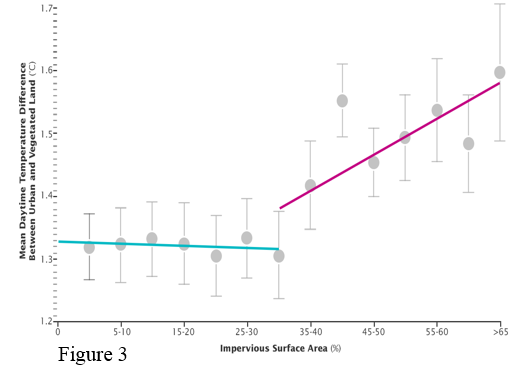
Figure 2. Temperature Difference (impervious-vegetated) Figure 3. Temperature Difference (impervious-vegetated) across impervious surface area gradient
Our results strongly support the concept that transpiration-driven cooling is a major factor modulating the SUHI, and that smaller cities, occupying about one third (35%) of their environment, may generate less heat. We find the ratio of surface runoff of each land cover class to incoming precipitation to be useful indicator for water discharge. We estimate the maximum carbon loss due to replacement of productive lands by ISs at 1.8% of the total uptake over the continental US as compared to 5.0% gain from agriculture. These carbon estimates are revealing of the significant impact of ISs on land productivity since agriculture represents 32.1% and the impervious area represents only 1.1% of the total continental US.