Using Landsat Global Land Survey Data to Measure and Monitor Worldwide Urbanization
Impervious surfaces, mainly artificial structures and roads, cover less than 1% of the world’s land surface (1.3% over USA). Regardless of the relatively small coverage, impervious surfaces have a significant impact on the environment at scale from the local to the global. They are the main source of the urban heat island effect, and affect not only the energy balance, but also hydrology and carbon cycling, and both land and aquatic ecosystem services. In the last several decades, the pace of converting natural land surface to impervious surfaces has increased. Quantitatively monitoring the growth of impervious surface expansion and associated urbanization has become a priority topic across both the physical and social sciences.
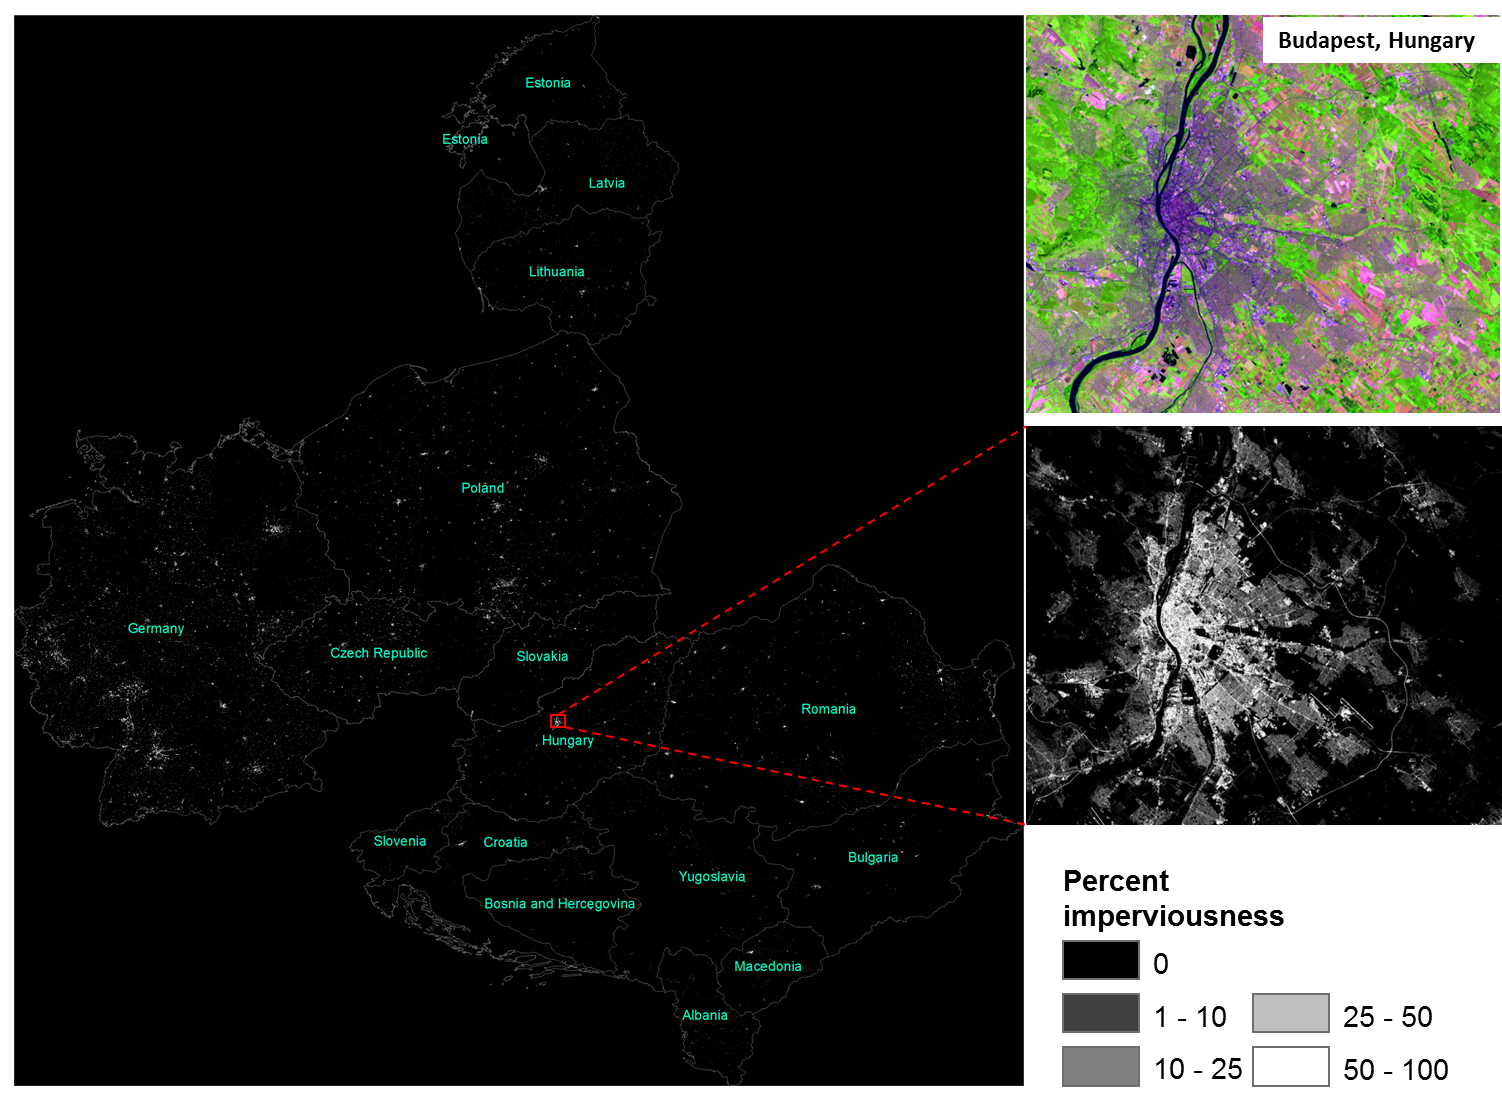
Figure 1. Urban impervious surface map for central and eastern European countries with a full resolution example over Budapest, Hungary.
The recent availability of consistent, global scale data sets at 30m resolution such as the Global Land Survey (GLS) from the Landsat satellites provides an unprecedented opportunity to map global impervious cover and urbanization at this resolution for the first time, with unprecedented detail and accuracy. Moreover, the spatial resolution of Landsat is absolutely essential to accurately resolve urban targets such a buildings, roads and parking lots. With long term GLS data now available for the 1975, 1990, 2000, 2005 and 2010 time periods, the land cover/use changes due to urbanization can now be quantified at this spatial scale as well. In the Global Land Survey – Imperviousness Mapping Project (GLS-IMP), we are producing the first global 30m spatial resolution impervious cover data set. We have processed the GLS 2010 data set to surface reflectance (8500+ TM and ETM+ scenes) and are using a supervised classification method using a regression tree to produce continental scale impervious cover data sets. A very large set of accurate training samples is the key to the supervised classifications and is being derived through the interpretation of high spatial resolution (~2 m or less) commercial satellite data (Quickbird and Worldview2) available to us through the unclassified archive of the National Geospatial Intelligence Agency (NGA). For each continental area several million training pixels are derived by analysts using in-house image segmentation algorithms and tools and then aggregated to the 30m resolution of Landsat. In this webinar we discuss the production/testing of this massive data set for Europe, North and South America, Australia and Africa, including assessments of the 2010 surface reflectance data. This type of analysis is only possible because of the availability of long term 30m data sets from GLS and shows much promise for integration of Landsat 8 data in the future. The GLS-IMP data global data for 2010 have been processed and are currently undergoing quality assessment. It is expected these data will become available to users later this year through the services of the Oak Ridge National Laboratory Distributed Active Archive Center (ORNL DAAC) for Biogeochemical Dynamics. The data will be comprised of global impervious cover fraction, per-pixel error estimates, and a global urban extent map (i.e. urban/non-urban). Read more about the project
