The Mega Urbanization of Beijing
In the decade of the 2000s, urbanization occurred at an astounding rate, especially in Asia, with the extensive development of numerous mega cities. Understanding of urban change becomes more imperative not only as the world becomes more urban than rural, but also as more urban dwellers live in conditions adversely impacted by the mega urbanization that can be observed and monitored with satellite remote sensing across administrative boundaries. Amongst the mega cities of the world, Beijing has undergone transformative changes with an extreme urbanization rate. In the face of double-digit ecoFnomic growth concentrated in the urban areas in Eastern China, Beijing and other cities have struggled to address the economic growth consequences such as rapid motorization driven by rapid income growth, huge demand for housing from migrants, and wealth-driven demand for larger floor space. To quantify Beijing urban change, multiple satellite datasets are used in a combination providing
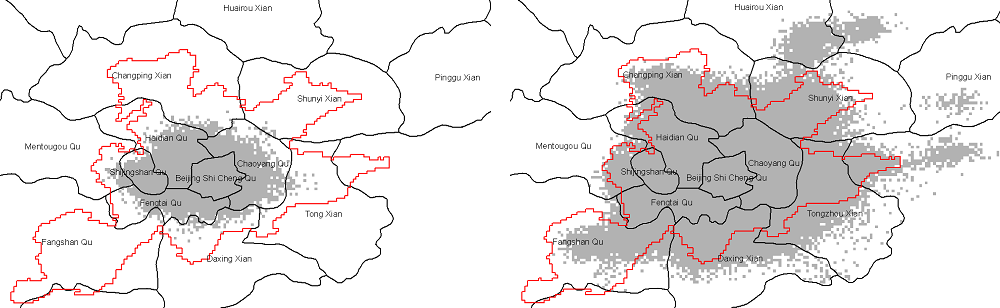
Figure 1. Satellite DSM observation of Beijing urban extent in grey shade or 2000 (left) and for 2009 (right). Red contours are for night-light extent in 1994-1995 and black lines are administrative boundary.
observations across different temporal and spatial scales. These include radar data from satellite scatterometer processed with the Dense Sampling Method (DSM) to posting resolution of about 1-km, night-light data acquired by the satellite Operational Linescan System (OLS) with a spatial resolution of about 1-km, and spectral data from Landsat with high resolution from 1 to 10s of meters. Derived from these satellite data, results of Beijing change are presented in Figures 1 and 2.
Figure 1 shows Beijing urban extent in 2000 (right panel) and in 2009 (left panel) from DSM measurements, which reveal a quadruple increase in the 2000s. Here urban extent is delineated based on physical infrastructures in the urban built environments (e.g., houses, buildings, factories, road network, etc.) developed and/or existed in a given year. Figure 2 presents detail information contents with OLS night-light and Landsat spectral data.

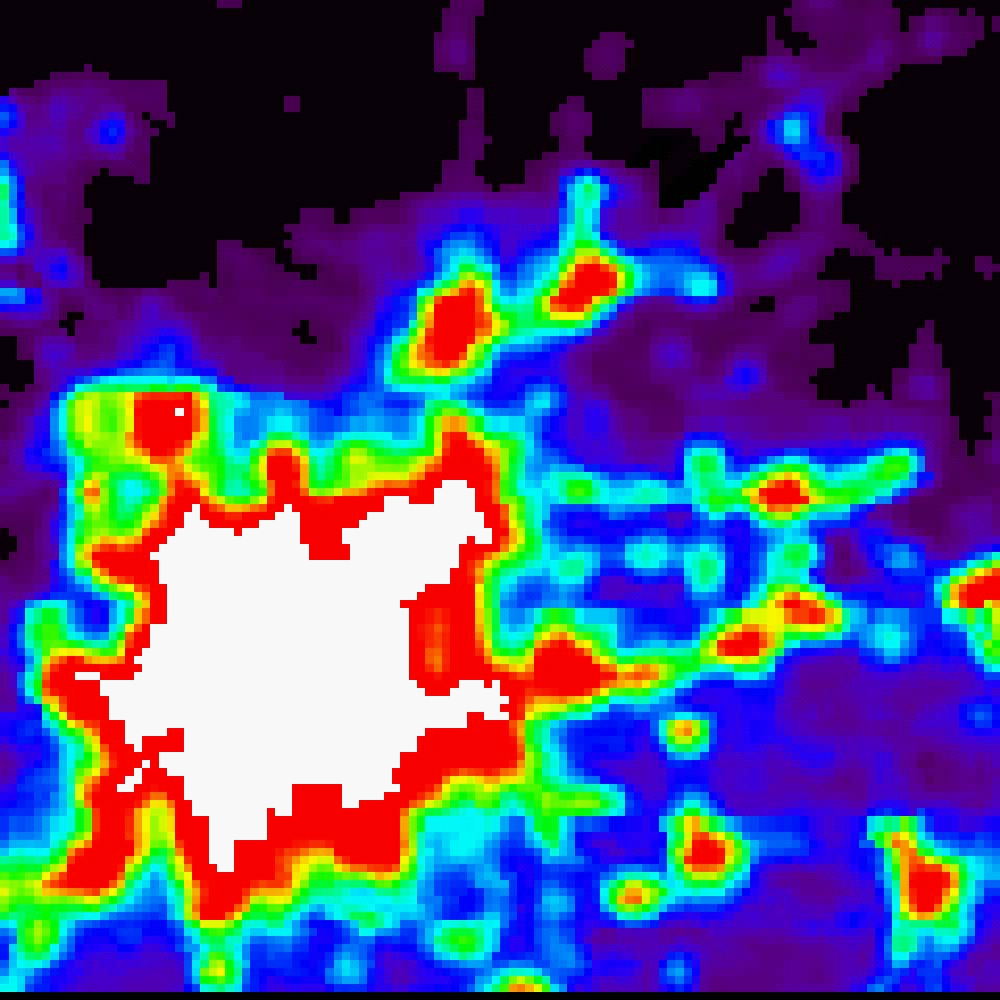
Figure 2. Stable night-light brightness for 2008 (left), and day-night composites combining Landsat and night-lights (right).
Stable night-light brightness (Figure 2, left panel) for 2008 ranges from dim-low values (purple to cyan) to brighter (green to red) and saturated (white). Unlighted areas (black) are undeveloped. Day-night composites (Figure 2, right panel) combine Landsat and night-lights to illustrate consistencies in land cover and night-light brightness. Superimposed night-light brightness (red) on upper (green) and lower (blue) bounding estimates of built-up extent shows high-density built environments (white) associated with bright night-lights, while agriculture and low-density rural land cover are associated with lower light levels.
These satellite results provide important observations of Beijing change and detail patterns outside and within the city that can be used with environmental (e.g., pollution, temperature, wind, etc.) and demographic and socioeconomic data (e.g., population density, population pattern and dynamics, housing census, etc.) together with a model nesting the urban scale to global circulation scale to understand the transformative change and impacts in Beijing and other mega cities across the world. Read more about the project